
Export diversification and Canada’s major trading partners
Canada’s Export Diversification Strategy facilitates efforts to help Canadian businesses reduce the uncertainties and potential disruptions they may face in international trade, as well as help them seize the opportunities created by diversifying to new global markets.

However, the destination of exports is only a part of the diversification story. There are several other measures of diversification. The chart below looks at one specific aspect of diversification: product diversity, which is the range of different products Canada exports. Using the Herfindahl–Hirschman Index (HHI)Footnote 1, a popular measure of diversification in economics, the chart examines the product diversity of Canada’s merchandise exports to our top three export destinations.
The shared land border, lower transportation costs due to proximity, and similarities in culture and language make the U.S. more accessible for a greater number of products. As such, it might be reasonable to expect that Canada’s exports of products to the U.S. are more diverse, and relatively less diverse to China or the European Union (EU‑27). Surprisingly, the reverse is true. In fact, Canada’s exports to both China and the EU‑27 are more diverse than Canada’s exports to the U.S., and have been for the last 20 years.
In the case of China, a common narrative is that Canada only exports coal. It’s true that coal exports are significant. However, in 2021, coal made up only approximately 12 percent of Canadian exports to China. Canada also exports iron and copper ore, wood, canola, cereals, and fish — and all of these products represent at least $1 billion in exportsFootnote 2. Likewise, in the case of the EU-27, Canada exports a lot of iron ore; however, Canada also exports a lot of aircrafts, machinery, mineral fuels, precious metals, and pharmaceuticals. For the U.S., the proximity might actually work against the product diversity. Crude oil accounts for over 20 percent of Canada’s exports to the U.S., partly because it is difficult to export the petroleum elsewhere. Similarly, the integrated nature of North American auto production accounts for over 10 percent of Canadian exports.
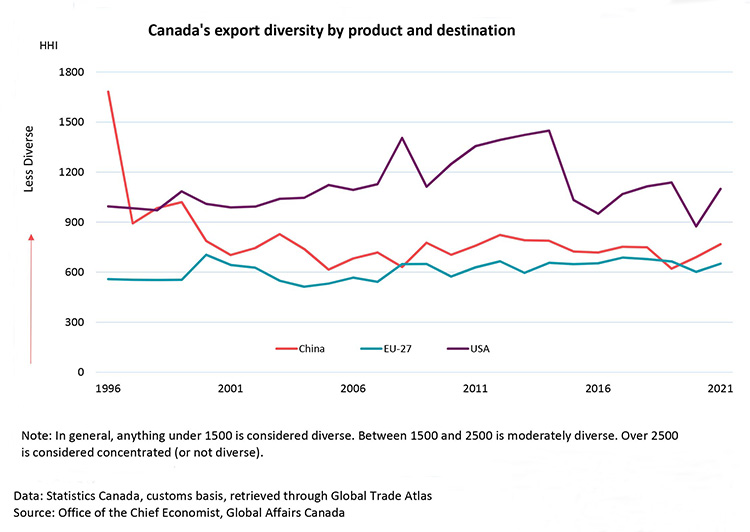
Canada's export diversity by product and destination
| 1996 | 2001 | 2006 | 2011 | 2016 | 2021 | |
|---|---|---|---|---|---|---|
| China | 1681.97 | 703.13 | 682.18 | 759.27 | 718.35 | 767.94 |
| EU-27 | 557.75 | 643.53 | 566.76 | 628.77 | 653.12 | 651.16 |
| USA | 994.63 | 988.61 | 1093.94 | 1355.77 | 950.49 | 1099.35 |
Note: In general, anything under 1500 is considered diverse. Between 1500 and 2500 is moderately diverse. Over 2500 is considered concentrated (or not diverse).
Data: Statistics Canada, customs basis, retrieved through Global Trade Atlas
Source: Office of the Chief Economist, Global Affairs Canada
The Upshot
Export diversification means more than just diversifying the destination of exports. It’s important to broaden our thinking and understand that the diversification of products, ownership, location and more benefit Canadian businesses and the Canadian economy. Given the proximity, it would be reasonable to expect that Canada’s mix of exported products would be the most diverse to the U.S.; however, Canada’s exports to our major overseas markets are actually more diverse than Canada’s exports to the U.S.. The Canadian Trade Commissioner Service (TCS) can help small businesses access these markets to maximize their global potential.
1 The HHI is a common index for measuring concentration ranging from 0 to 10,000, with 10,000 being the most the most concentrated. HHI=∑_(i=1)^N▒〖S_i*10,000〗 where si is product i's share of the export basket, and N is the number of products at the HS‑2 level (about 97 product categories depending on the year).
2 The decrease in the export concentration to China from 1996 to 1997 was due to a decrease in wheat exports. In 1996, wheat made up 36 percent of Canadian exports to China. In 1997, the share of wheat dropped to 18 percent.
Subscribe to: CanadExport